Python应用与开发
记录Python使用的点点滴滴。
1、numpy中的axis
设axis=i,则numpy沿着第i个下标变化的方向进行操作。 1
2
3
4
5
6
7
8
9
10
11
12
13
14
15
16
17
18
19
20
21
22
23
24
25
26
27
28
29
30
31
32
33
34
35
36t = np.random.randint(0, 5, [2,3,4,5])
axisCount = t.ndim #axis的数目=4
t.sum(axis=0).shape #沿着第1个维度方向变化,此处sum结果的shape=(3,4,5)
t.sum(axis=1).shape
#沿着第2个维度方向变化,此处sum结果的shape=(2,4,5)
t.sum(axis=2).shape
#沿着第3个维度方向变化,此处sum结果的shape=(2,3,5)
t.sum(axis=3).shape
#沿着第4个维度方向变化,此处sum结果的shape=(2,3,4)
ax1,ax2,ax3,ax4 = t.shape
v = np.zeros((ax2,ax3,ax4))
for i in range(ax1): # 沿着第1个维度
v = v + t[i]
print((v==t.sum(axis=0)).all()) # 结果为true
v = np.zeros((ax1,ax3,ax4))
for i in range(ax2):
# 沿着第2个维度
v = v + t[:,i,:,:]
print((v==t.sum(axis=1)).all()) # 结果为true
v = np.zeros((ax1,ax2,ax4))
for i in range(ax3):
# 沿着第3个维度
v = v + t[:,:,i,:]
print((v==t.sum(axis=2)).all()) # 结果为true
v = np.zeros((ax1,ax2,ax3))
for i in range(ax4):
# 沿着第4个维度
v = v + t[:,:,:,i]
print((v==t.sum(axis=3)).all()) # 结果为true
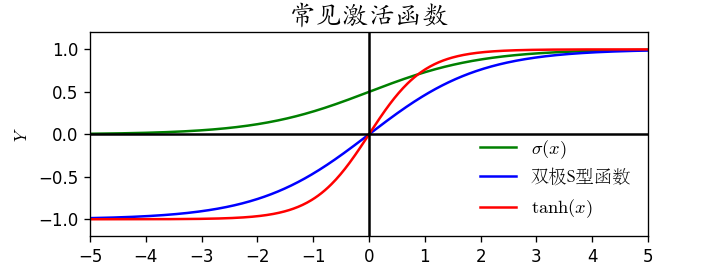
2、绘制S形函数与双极S形函数
1 | #!/usr/bin/python3 |
图像如下: 
3、Matplotlib 2.0.0中Latex的字体问题
Matplotlib 1.x版本中默认的Latex字体是Computer Modern Roman(简写为cm),2.0.0版本中mathtext的字体为dejavusans,显示公式很难看。作一下修改: 方法一:在matplotlibrc中修改: 在用户目录的.matplotlib文件夹(C:\Users\YourName\.matplotlib)内,复制一份matplotlibrc文件,并将mathtext.fontset修改为cm 1
2
3
4
5
6
7#mathtext.sf : sans
mathtext.fontset : cm # Should be 'dejavusans' (default),
# 'dejavuserif', 'cm' (Computer Modern), 'stix',
# 'stixsans' or 'custom'
#mathtext.fallback_to_cm : True # When True, use symbols from the Computer Modern
# fonts when a symbol can not be found in one of
# the custom math fonts.rc函数修改 1
2
3
4
5
6
7
8
9
10# 恢复默认配置
#plt.rcdefaults()
# 显示默认配置
#plt.rcParamsDefault
# 将数学公式字体设为'Computer Modern Roman'(简写为cm),Latex默认字体
from matplotlib import rc
rc('mathtext',fontset='cm')
# 显示当前配置
#plt.rcParams
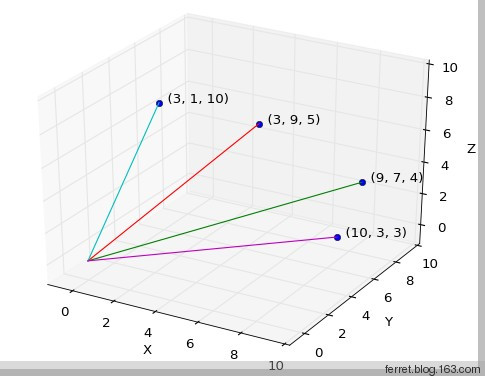
4、绘制3D矢量与颜色混合图
参考: http://matplotlib.org/mpl_toolkits/mplot3d/tutorial.html http://matplotlib.org/gallery.html http://matplotlib.org/examples/index.html 效果: 
 Code:
Code: 1
2
3
4
5
6
7
8
9
10
11
12
13
14
15
16
17
18
19
20
21
22
23
24
25
26
27
28
29
30
31
32
33
34
35
36
37
38
39
40
41
42
43
44
45
46
47
48
49
50
51
52
53
54
55
56
57
58
59
60
61
62
63
64
65
66
67
68
69
70
71
72
73
74
75
76
77
78
79
80
81
82
83
84
85
86
87
88
89
90
91
92
93
94
95
96
97
98
99
100
101
102
103
104
105
106
107
108
109
110
111
112
113
114
115# -*- coding: utf-8 -*-
"""
Created on Sun Jan 05 13:14:34 2014
@author: Ferret
"""
import numpy as np
import matplotlib.pyplot as plt
from mpl_toolkits.mplot3d import Axes3D
from numpy import linalg
import matplotlib.patches as mpatches
from matplotlib.collections import PatchCollection
def cal_angle(aPoint,bPoint):
## 余弦定理求夹角
dot_value = np.dot(aPoint,bPoint)
aPoint_length = linalg.norm(aPoint)
bPoint_length = linalg.norm(bPoint) # == sqrt(np.dot(bPoint,bPoint))
angle = np.arccos(dot_value/(aPoint_length*bPoint_length))*180/np.pi
point_dist = linalg.norm(aPoint-bPoint)
return point_dist,angle
def label_point(ax,points):
for point in points:
(xpt,ypt,zpt)=tuple(point)
label = ' (%d, %d, %d)' % (xpt, ypt, zpt)
ax.text(xpt, ypt, zpt, label)
def plot_vector(points):
fig = plt.figure()
ax = fig.gca(projection='3d')
ax.set_xlabel("X")
ax.set_ylabel("Y")
ax.set_zlabel("Z")
ax.set_xlim(-1,10)
ax.set_ylim(-1,10)
ax.set_zlim(-1,10)
ax.plot(points[:,0],points[:,1],points[:,2],'o')
label_point(ax,points)
for point in points:
line = np.vstack((point,np.array([0,0,0])))
ax.plot(line[:,0],line[:,1],line[:,2])
plt.show()
def make_grid():
radius=0.1
center = np.array([0.5,0.5])
patch_bottom = np.array([0,-radius])
x = radius*np.cos(np.pi/6)
y = radius*np.sin(np.pi/6)
patch_left = np.array([-x,y])
patch_right = np.array([x,y])
bottom = center + patch_bottom
left = center + patch_left
right = center + patch_right
grid = np.vstack((bottom,left,right))
return grid
def plot_circle():
fig, ax = plt.subplots()
# create 3x3 grid to plot the artists
#grid = np.mgrid[0.2:0.8:3j, 0.2:0.8:3j].reshape(2, -1).T
grid = make_grid()
circles = []
# add a circle
radius = 0.1
circle1 = mpatches.Circle(grid[0], radius,ec="none")
circles.append(circle1)
circle2 = mpatches.Circle(grid[1], radius,ec="none")
circles.append(circle2)
circle3 = mpatches.Circle(grid[2], radius,ec="none")
circles.append(circle3)
colors = np.linspace(0.2, 1, len(circles)*2)
collection = PatchCollection(circles, cmap=plt.cm.hsv, alpha=0.3)
collection.set_array(colors)
print colors
ax.add_collection(collection)
#ax.add_line(line)
plt.subplots_adjust(left=0, right=1, bottom=0, top=1)
plt.axis('equal')
#plt.axis('off')
plt.show()
def vect_line():
N=4 # 4个点
pts= np.round(np.random.random(N*3).reshape(N,3)*10)
#pts = np.array([[10,0,0],[1,10,0]])
print "pt:",tuple(pts[0]),"and pt:",tuple(pts[1])
print ("distance:%0.2f, angle:%0.2f" %(cal_angle(pts[0],pts[1])))
plot_vector(pts)
#make_grid()
plot_circle()
if __name__ == "__main__" :
vect_line()
5、正则表达式

使用re.compile(pattern,flag)创建正则表达式匹配模式时flag含义:
| 标志 | 简写 | 含义 |
|---|---|---|
| re.ASCII | re.A | \w, \W, \b, \B, \d, \D, \s 和 \S 只匹配ASCII码 |
| re.DEBUG | \ | 显示表达式编译的调试信息 |
| re.IGNORECASE | re.I | 忽略大小写(只针对ASCII码) |
| re.LOCALE | re.L | 指示\w, \W, \b, \B, \s 和 \S 依赖于本地语言编码. 仅限于 bytes 匹配模式. |
| re.MULTILINE | re.M | 设定时,模式”^”在字符串的开始处和每行的开头匹配(紧跟在每个换行符之后); 且模式”$”匹配字符串的末尾和每行的末尾(紧邻每个换行符)之间匹配。 默认情况下,’^’仅匹配字符串的开头,而’$’仅在字符串的末尾,紧跟在字符串末尾的换行符(如果有)。 |
| re.DOTALL | re.S | 设定该标志时, ‘.’ 可以匹配所有字符包括换行符”\n”,否则不匹配换行符 |
| re.VERBOSE | re.X | 在pattern内部,视’#’开始的字串为注释,对pattern无影响。 |
6、使用lxml解析SVG
以下代码获取svg中的各个图片元素:
1 | from lxml import etree |
结合Qt,将Svg中的图片保存为PNG图片格式:
1 | from lxml import etree |
本文来自:Python绘图